Graphical Analysis Of Packet Error Rate (PER) Test
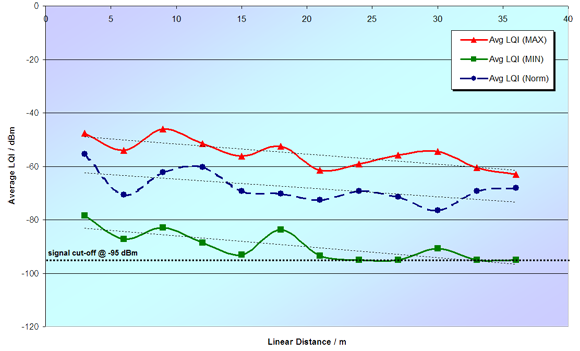
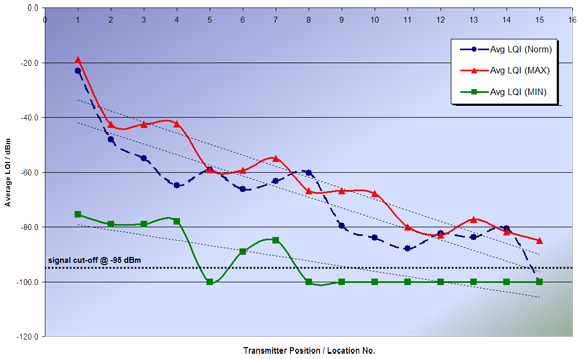
The PER Test used to obtain the following results has been outlined here. For each of the following tests, the power was changed from it's nominal value to it's minimum (in blue) and maximum (in red) transmission power ratings; +5 dBm and -16 dBm, respectively. It is obvious from the results why the ZigBee units are programmed to operate between those limits (for the sake of battery life and maximum realizable transmission range).
- RF CAD Lab area - Graph of Link Quality Index vs. Location No.
- Main Hall, LOS - Graph of Link Quality Index vs. Linear Distance